
4D Chart v13
Creating Graphs from Arrays (examples)
 Creating Graphs from Arrays (examples)
This section provides examples that use the CT Chart arrays function to create two- and three-dimensional graphs.
If you want to create graphs programmatically from records in a database, refer to the section Creating Graphs from Records in a Database (examples).
In each example, you will find:
- A description of the situation used for the example,
- The structure of the example database,
- A graph that has been created entirely programmatically, using example data,
- The code used to create the example graph.
Suppose that you are a new manager in the Engineering division of a company that manufactures widgets. One of your new responsibilities is to decrease the amount of time your departments take to respond to customers’ requests for help.
You decide to design a database to track the response time of each department. The structure of your database is as follows:
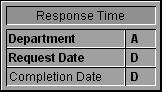
To analyze the information you have gathered, you decide to graph the average response time ((Completion Date - Request Date)/ # of requests) for each department for each month of the past year. Using 4D Chart, you produce the following graph:
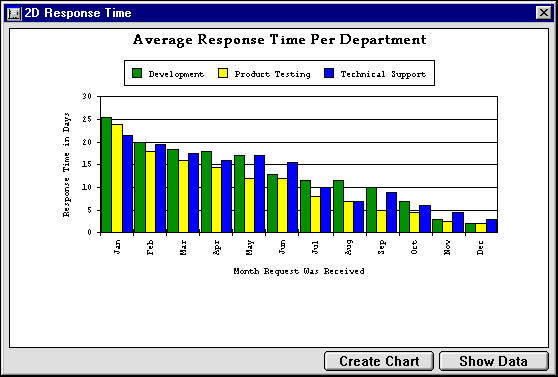
This graph was generated and formatted using the GR RESPONSE method. This method fills arrays with data, generates a graph from the arrays, and then customizes certain aspects of the graph, such as the axis titles and series colors.
The first part of the method uses 4D commands and functions to create and fill the arrays. The contents of the Categories array are hardcoded, the contents of the Series array are taken directly from the database, and the contents of the Values array are the results of data manipulation. The size of the Values array is equal to the size of the Categories array multiplied by the size of the Series array.
This method uses sets to manipulate the selection of records. After you have created a set, you can change the selection of records as needed by searching and then return to the original set of records again and again. In this method, a set is used to maintain the selection of records for the entire graph. The selection is altered during the filling of the Values array, because the values are determined by the selection that results from searching for the records for each department for each month.
After the arrays are filled, 4D Chart commands are used to create the graph and modify its features.
The following is the GR RESPONSE method:
  `Method: GRAPH RESPONSE

  `Categories: Months of the year

  `Series: Department names

  `Values: Average task duration (in days)


 C_LONGINT($x;$y;$z;$Counter)

 C_LONGINT($Left;$Top;$Right;$Bottom)

 C_LONGINT($Left2;$Top2;$Right2;$Bottom2)

 C_LONGINT($Area;$Chart;$Title;$Locate;$Duration;$Color;$Font)


  `Define and fill the categories array

 ARRAY STRING(3;$aCategories;12)

 $aCategories{1}:="Jan"

 $aCategories{2}:="Feb"

 $aCategories{3}:="Mar"

 $aCategories{4}:="Apr"

 $aCategories{5}:="May"

 $aCategories{6}:="Jun"

 $aCategories{7}:="Jul"

 $aCategories{8}:="Aug"

 $aCategories{9}:="Sep"

 $aCategories{10}:="Oct"

 $aCategories{11}:="Nov"

 $aCategories{12}:="Dec"


  `Generate the selection of records to chart

  `Store the records in a set for later use

 QUERY BY FORMULA([Response Time];Year of([Response Time]Request Date)=1993)

 CREATE SET([Response Time];"sChartData")


  `Define and fill the Series array with department names

 ARRAY STRING(20;$aSeries;0)

 DISTINCT VALUES([Response Time]Department;$aSeries)


  `Determine the number of values to chart

  `(number of values = categories * series)

  `Dimension the values array

 ARRAY REAL($aValues;12*Size of array($aSeries))


  `Determine and fill the values array

  `For each department find average task durations per month

 $Counter:=0 `counter to keep to track of values

 For($x;1;Size of array($aSeries)) `…loop for the number of departments

    For($y;1;12) `…loop for the 12 months

       $Counter:=$Counter+1

       QUERY SELECTION([Response Time];[Response Time]Department=$aSeries{$x})

       QUERY SELECTION BY FORMULA([Response Time];Month of([Response Time]Request Date)=$y)

       If(Records in selection([Response Time])>0)

          $Duration:=0 `counter for incrementing durations

          For($z;1;Records in selection([Response Time]))

             GOTO SELECTED RECORD([Response Time];$z)

             $Duration:=$Duration+([Response Time]Completion Date-[Response Time]Request Date)

          End for

          $aValues{$Counter}:=$Duration/Records in selection([Response Time])

       End if

       USE SET("sChartData") `Restore the original selection of records

    End for

 End for


  `Hide interface elements

 CT SET DISPLAY(Area;1;0) `Hide menus

 CT SET DISPLAY(Area;2;0) `Hide Chart tools

 CT SET DISPLAY(Area;3;0) `Hide Object tools

 CT SET DISPLAY(Area;6;0) `Hide Scroll bars

 CT SET DISPLAY(Area;9;0) `Hide Rulers


  `Create a column chart

 $Chart:=CT Chart arrays(Area;2;1;$aCategories;$aSeries;$aValues)


  `Add category and value axis titles

 CT SET TITLE ATTRIBUTES(Area;$Chart;2;2;3;"Response Time in Days")

 CT SET TITLE ATTRIBUTES(Area;$Chart;0;3;0;"Month Request Was Received")


  `Set the series colors (Green, Yellow, Blue)

 CT SET CHART FILL ATTRIBUTES(Area;$Chart;8;100;3;CT Index to color(10))

 CT SET CHART FILL ATTRIBUTES(Area;$Chart;8;200;3;CT Index to color(2))

 CT SET CHART FILL ATTRIBUTES(Area;$Chart;8;300;3;CT Index to color(7))


  `Set the legend position to top center, horizontal orientation

 CT SET LEGEND ATTRIBUTES(Area;$Chart;1;0;0;0;7;0;0)


  `Add a title at the top left hand corner

 $Title:=CT Draw text(Area;1;1;300;3;"Average Response Time Per Department")


  `Format title (Palatino, 14 point, Bold, Center, Black)

 $Color:=CT Index to color(16)

 $Font:=CT Font number("Palatino")

 CT SET TEXT ATTRIBUTES(Area;$Title;$Font;14;1;$Color;1)


  `Get area dimensions for centering

 CT GET AREA BOUNDARY(Area;1;$Left;$Top;$Right;$Bottom)


  `Resize the chart to window size minus 50 points

 CT SIZE(Area;$Chart;$Right-50;$Bottom-50)


  `Center chart

 CT GET BOUNDARY(Area;$Chart;$Left2;$Top2;$Right2;$Bottom2)

 $Locate:=(($Right-$Left)-($Right2-$Left2))/2

 CT MOVE(Area;$Chart;$Locate;$Top2)


  `Center title

 CT GET BOUNDARY(Area;$Title;$Left2;$Top2;$Right2;$Bottom2)

 $Locate:=(($Right-$Left)-($Right2-$Left2))/2

 CT MOVE(Area;$Title;$Locate;$Top2)


  `Move the Chart 10 points down

 CT GET BOUNDARY(Area;$Chart;$Left;$Top;$Right;$Bottom)

 CT MOVE(Area;$Chart;$Left;$Top+10)


  `Deselect all objects

CT SELECT(Area;-1;0)Suppose you are Western Regional Director of an educational program, and you would like to determine whether the test scores of students in your region have been improving. Your database contains the scores for students in your region, tagged by test date and home state.
Note: This is the same data used in the example Creating a Two-Dimensional Graph with the Series Defined by Data in Records in the section Creating Graphs from Records in a Database (examples).
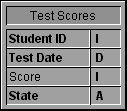
Because there were multiple test dates in each year, you cannot graph the data directly from the database. Instead, you create a method that places the data in arrays, enabling you to use each year as a category and the individual states as the series.
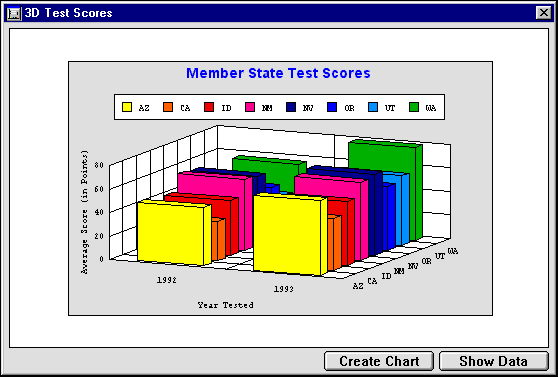
This graph was generated using the GRAPH SCORES 3D method. This method fills the arrays with data, generates a graph from the arrays, and then customizes certain aspects of the graph.
The contents of the Categories array are hardcoded. The contents of the Series array are taken from the database. The contents of the Values array are the averages of each state’s test scores for each year. The size of the Values array is equal to the size of the Categories array multiplied by the size of the Series array.
Using 4D Chart commands, the 4D Chart menu bar, scroll bars, rulers, and tool palettes are hidden. The 4D Chart area is set to Non-enterable, meaning that the user cannot select any object in the area or make any changes to it.
The following is the GRAPH SCORES 3D method:
  `Method: GRAPH SCORES 3D

  `Categories: Survey years

  `Series: Member States

  `Values: Test scores


 C_LONGINT($x;$y;$z;$Counter)

 C_LONGINT($Left;$Top;$Right;$Bottom)

 C_LONGINT($Left2;$Top2;$Right2;$Bottom2)

 C_LONGINT($Area;$Chart;$Title;$Locate;$Score;$Color;$Font;$Rect)


  `Define and fill the categories array

 ARRAY STRING(4;$aCategories;2)

 $aCategories{1}:="1992"

 $aCategories{2}:="1993"


  `Define and fill the Series array with State names

 ALL RECORDS([Test Scores])

 ARRAY STRING(2;$aSeries;0)

 DISTINCT VALUES([Test Scores]State;$aSeries)


  `Dimension the values array

  `(number of values to chart = categories * series)

 ARRAY REAL($aValues;2*Size of array($aSeries))


  `Determine and fill the values array

  `For each State find average score

 $Counter:=0 `counter to keep to track of values

 For($x;1;Size of array($aSeries)) `…loop for the number of States

    For($y;1;2) `…loop for the 2 years

       $Counter:=$Counter+1

       QUERY([Test Scores];[Test Scores]State=$aSeries{$x})

       QUERY SELECTION BY FORMULA([Test Scores];

       String(Year of([Test Scores]Test Date))=$aCategories{$y})

       If(Records in selection([Test Scores])>0)

          $Score:=0 `temp storage for incrementing scores

          For($z;1;Records in selection([Test Scores]))

             GOTO SELECTED RECORD([Test Scores];$z)

             $Score:=$Score+[Test Scores]Score

          End for

  `Average the score

          $aValues{$Counter}:=$Score/Records in selection([Test Scores])

       End if

    End for

 End for


  `Restore selection

 ALL RECORDS([Test Scores])


  `Hide interface elements

 CT SET DISPLAY(Area;1;0) `Hide menus

 CT SET DISPLAY(Area;2;0) `Hide Chart tools

 CT SET DISPLAY(Area;3;0) `Hide Object tools

 CT SET DISPLAY(Area;6;0) `Hide Scroll bars

 CT SET DISPLAY(Area;9;0) `Hide Rulers


  `Create a 3D column chart

 $Chart:=CT Chart arrays(Area;100;1;$aCategories;$aSeries;$aValues)


  `Show/hide axis titles

 CT SET TITLE ATTRIBUTES(Area;$Chart;0;3;0;"Year Tested")

 CT SET TITLE ATTRIBUTES(Area;$Chart;1;1;0;"State") `Hide title

 CT SET TITLE ATTRIBUTES(Area;$Chart;2;2;3;"Average Score (in Points)")


  `Set the legend position to top center, horizontal orientation

 CT SET LEGEND ATTRIBUTES(Area;$Chart;1;0;0;0;7;0;0)


  `Add a chart title at the top left hand corner

 $Title:=CT Draw text(Area;1;1;350;3;"Member State Test Scores")


  `Format chart title (Geneva, 14 point, Bold, Center, Blue)

 $Color:=CT Index to color(7)

 $Font:=CT Font number("Geneva")

 CT SET TEXT ATTRIBUTES(Area;$Title;$Font;14;1;$Color;1)


  `Get window dimensions to use for centering

 CT GET AREA BOUNDARY(Area;1;$Left;$Top;$Right;$Bottom)


  `Resize the chart to window size minus 50 points

 CT SIZE(Area;$Chart;$Right-50;$Bottom-50)


  `Center the chart horizontally

 CT GET BOUNDARY(Area;$Chart;$Left2;$Top2;$Right2;$Bottom2)

 $Locate:=(($Right-$Left)-($Right2-$Left2))/2

 CT MOVE(Area;$Chart;$Locate;$Top2)


  `Center the title horizontally

 CT GET BOUNDARY(Area;$Title;$Left2;$Top2;$Right2;$Bottom2)

 $Locate:=(($Right-$Left)-($Right2-$Left2))/2

 CT MOVE(Area;$Title;$Locate;$Top2)


  `Move the Chart 10 points down from title

 CT GET BOUNDARY(Area;$Chart;$Left;$Top;$Right;$Bottom)

 CT MOVE(Area;$Chart;$Left;$Top+10)


  `Frame the chart and title with a grey rectangle

 $Rect:=CT Draw rectangle(Area;$Left-2;$Top2-2;$Right+2;$Bottom+2+10;0)

 CT SET FILL ATTRIBUTES(Area;$Rect;3;CT Index to color(13))


  `Center all objects vertically

 CT GET AREA BOUNDARY(Area;1;$Left;$Top;$Right;$Bottom)

 CT GET BOUNDARY(Area;-1;$Left2;$Top2;$Right2;$Bottom2)

 $Locate:=(($Bottom-$Top)-($Bottom2-$Top2))/2

 CT MOVE(Area;-1;$Left2;$Locate)


  `Send the rectangle to the back

 CT SELECT(Area;-1;0) `Deselect all

 CT SELECT(Area;$Rect;1) `Select rectangle

 CT DO COMMAND(Area;24002) `send to back

 CT SELECT(Area;-1;0) `Deselect all


  `Deselect all objects

 CT SELECT(Area;-1;0
Product: 4D Chart
Theme: Introduction to the language
Creating Graphs from Records in a Database (examples)


